Qubit Systems, in collaboration with our European partners Photon Systems, were the first to develop a commercial system for imaging chlorophyll fluorescence kinetics.
Chlorophyll fluorescence is an extremely valuable technique in plant physiology used for rapid noninvasive measurements of photosystem II activity. PSII is very sensitive to numerous biotic and abiotic factors so that chlorophyll fluorescence may be used as a rapid indicator of photosynthetic performance in response to changing environmental conditions, and during different developmental stages of the plant. The FluorCam imaging systems monitors fluorescence kinetics using a pulse amplitude modulated method PAM, which allows for all major fluorescence parameters (not just Fv/Fm) to be measured and imaged.
The system consists of a CCD camera for measurement and a multicolored LED light panel that provides:
- pulse- modulated short duration flashes for correct determination of the minimal fluorescence F0 value
- Two types of actinic light
- Saturating light pulse for measurement of maximal fluorescence Fm value
Chlorophyll fluorescence measurements are conducted on single plants or multiple plants based on user-defined software protocols. Measured data are analyzed and stored automatically.

The advantage of chlorophyll fluorescence measurements over other methods for stress monitoring is that changes in chlorophyll fluorescence parameters often occur before other effects of stress are apparent. The method is non-invasive, and the spread of inhibition can be observed and quantified with time. Heterogeneity in the location of inhibition is easily seen and quantified when using imaging systems to measure chlorophyll fluorescence. To this end, high throughput measurements of chlorophyll fluorescence may be used to select mutants or GMOs that maintain high rates of photosynthesis under stress conditions. Qubit Systems offers a wide range of instruments for chlorophyll fluorescence measurements and imaging, ranging from hand-held devices to high throughput screening systems.


Unlike the single flash OJIP method, the PAM technique used in the PlantScreenTM Imaging Station is the only method that allows in depth analyses of the entire range of chlorophyll fluorescence parameters in relation to PSII activity and its response to environment. Also, the PAM technique allows for a far more accurate measurement of Fo than is possible using other techniques, and thus increases the accuracy of all other fluorescence parameters. However, should the user wish to measure OJIP, the high frame rate and high resolution of the FluorCam camera also allows for single flash OJIP image capture and analysis at 1000 fps with 1280 x 1024 pixel resolution. A windowing mode allows frame rates of up to 16,000 fps at lower resolution.
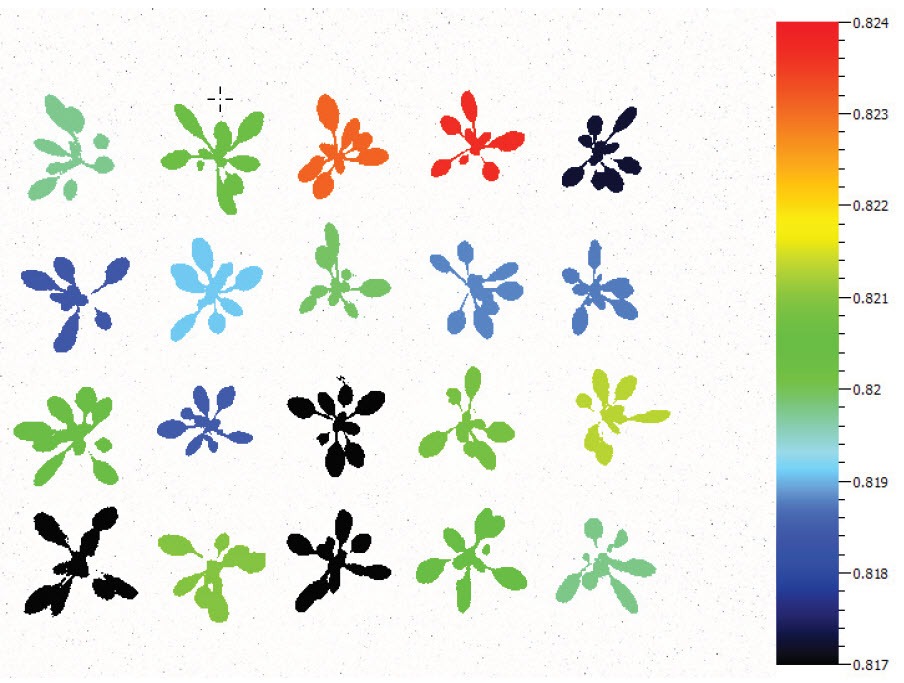
Don’t be confused by chlorophyll fluorescence imaging systems that may be offered by other companies. Often, these only measure continuous fluorescence that is useful only for identifying chlorophyllous tissue against background. Qubit’s imaging system monitors fluorescence kinetics, which provides a wealth of information about a plant’s photosynthetic capacity, physiological and metabolic condition, as well as its susceptibility to various stress conditions. For example, most healthy plants have a very conservative value of Fv/Fm of about 0.8. With many abiotic stresses, this value declines markedly, and well before any visible indicators of stress are apparent visually. Thus, measurements of Fv/Fm can identify the onset of stress much more effectively than measuring the change in slope of a growth curve. Changes in Fv/ Fm can also be used as alarms to trigger rescue protocols for stressed plants, such as irrigation of plants undergoing drought conditions.
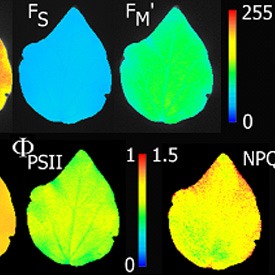
- Fo, Fm, Fv, Fo’, Fm’, Fv’, QY(II)
- NPQ
- Fv/Fm (Maximum efficiency of photosynthesis)
- Fv’/Fm’,
- Fq’/Fm’ (Operating efficiency of photosynthesis PSII),
- Rfd,
- qN,
- qP,
- PAR-absorptivity
- Photosynthetic electron transport rate
- Quenching
- Kautsky induction
- OJIP
- QA reoxidation
- Fast fluorescence induction
Software allows batch analysis of images for fluorescence quenching parameters including user-identified regions of interest and averaging of pixel values on background subtracted images. Analyzed data are stored in the database with co-registration of raw image data and analyzed data.


LED Lighting
Super bright LED panels with optional wavelengths (eg. 390, 450, 470, 505, 570, 605, 630, 735 nm (other also available)) STF – Single Turnover Flash IR 735 nm (FAR) Actinic light up to 3,000 µmol (photons)/m²s Super pulse up to 7,500 µmol (photons)/m²s Variable excitation color

Filters
7 position filter wheel (optional) Chlorophyll fluorescence (high pass 695 nm, low pass 780 nm), GFP (high pass 495, low pass 660 nm, band pass 505/560 Optional imaging formats are designed for measurements of slow processes and for applications where the higher spacial resolution is of importance
Protocols
Automated experimental protocols via a Windows Wizard Multiple (automatically repeated) experiments Automated labeling of individual plants, or samples, Kinetic analysis of data from all samples Numerous image manipulation tools
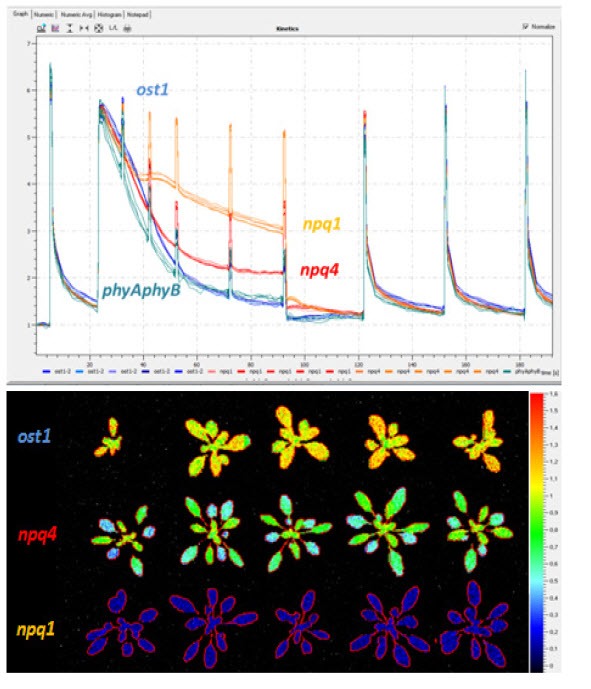
Transient kinetic fluorescence curves for fluorescence quenching protocol measured in light- and dark- adapted state. Kinetic curves and pixel-by-pixel false color image of non-photochemical quenching for Arabidopsis npq, phyAphyB and ost1 mutants.


