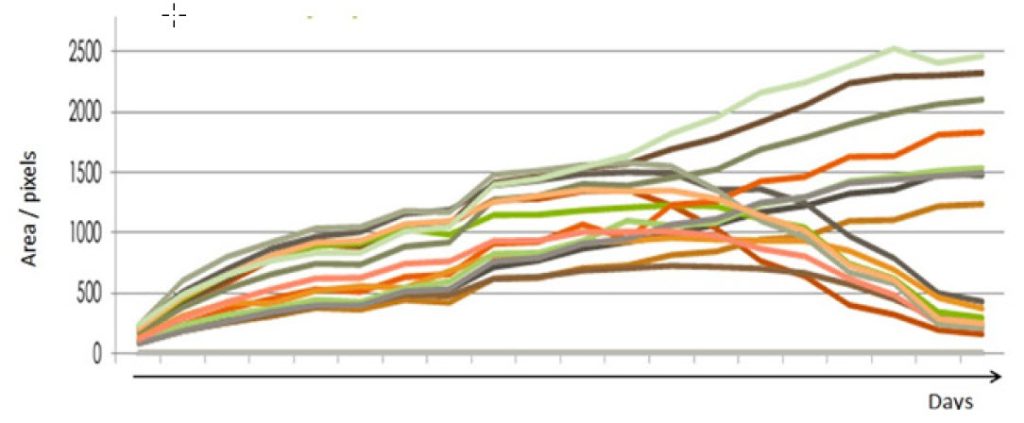
A central feature of any phenomics screening system is the ability to track growth patterns of plants as they progress through developmental stages and/or through the imposition, onset and recovery from stresses. All PlantScreenTM systems incorporate imaging stations for morphometric analysis of plants, as well as colour analysis.
Morphometric and colour analysis may be conducted with equal effectiveness on monocotyledenous and dicotyledonous plants. Scanning is rapid for high throughput analysis, and automated protocols in software correct for any image distortions and provide accurate data of key morphomteric parameters chosen by the operator. The data are collated with data from other imaging stations, if employed, to correlate changes in growth patterns with physiological responses to imposed environmental conditions.

- 2D or 3D scanning mode
- Top view up to 150 cm plant height
- Side view up to 150 cm plant height
- Side view in range 0–360°
- Line scanning mode for side view
- Species oriented analysis (mono and di-cotyledonous plants)
- Static and dynamic analysis
- Homogeneous LED light source


RGB images are scanned with a resolution of 5 to 25MP from three directions (from the sides and from the top). Samples are illuminated with consistent quantity and quality of light. Options are available for the inclusion of novel 3D scanning technology for the most in-depth morphometric reconstruction of plants.
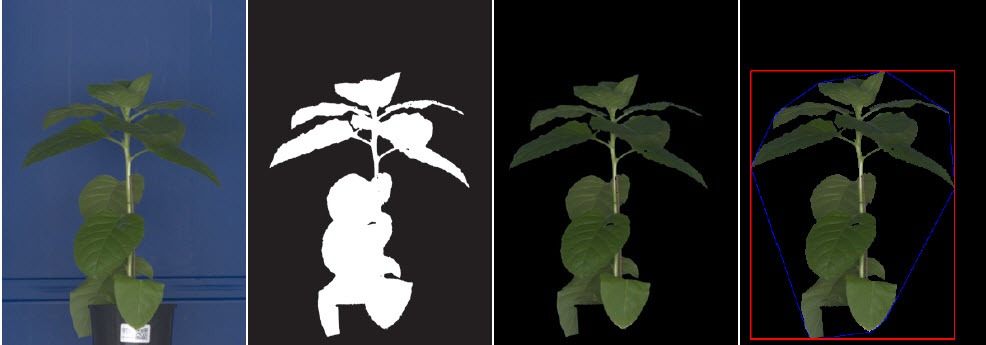
Step 1 (A): Barrel distortion correction
Step 2 (B): Tray detection and cropping
Step 3 (C): Background subtraction
Results (D): Binary and RGB images as input for analysis


Parameter measurements have been successfully validated using model objects with known shape and dimensions:


Morphological segmentation and leaf tracking analysis is used to characterize development and architecture of individual plant leaves as they progress through development or progression of stress imposition. PlantScreenTM System algorithm for leaf tracking runs over binary representations of individual plants and the time series.

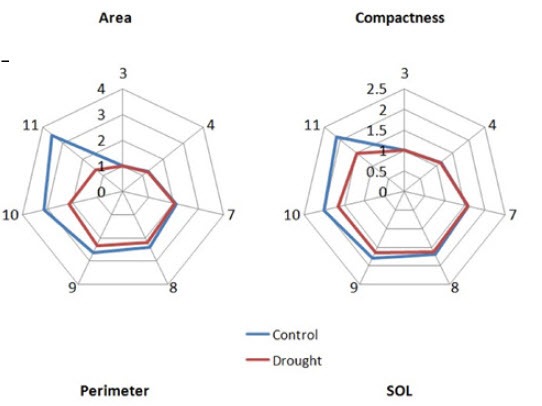
Progressive drought stress analysis in Arabidopsis Col-0 plants.Drought stress influenced not only biomass production but also the morphology of the plants. Other parameters e.g. compactness and perimeter were also affected.

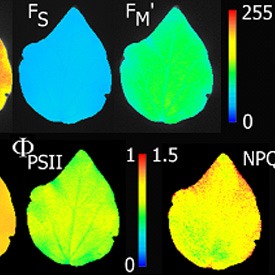
Greening index for different plants characterizing species specific pigments content in leaves. 25-hue color scale include green, yellow and red color spectra for the greening index analysis. Charts show the proportion of each hue in the corresponding plants above.